


Few rivalries in baseball have as much bite as Mets against Phillies. The two teams play in the same division, the ballparks are only a couple of hours apart, and the fans never let each other forget a bad night. The 2026 season gave them 13 games, a lot of loud moments, and plenty of numbers to dig through.
If you came here for Mets vs Phillies match player stats, you probably want to know who played well, who struggled, and what it all means. This article covers that in plain language. It uses the StatMuse season table for the big picture and a Yahoo Sports box score for the details of one game.
How the 2026 Season Series Played Out
The two teams were close to even for most of the year. Philadelphia held a 5-4 edge through the first nine games, and the season series was tied 6-6 by the time they met for the 13th time on September 20. The Mets won 10-3 on September 19, after trailing 3-1 in that game. The Phillies then won the finale at Citi Field, which by my count gave them a 7-6 edge over the full season. Check the official MLB standings if you need exact records.
That close finish is a little surprising when you look at how each team did overall. The Phillies finished 88-74 in second place in the NL East and made the playoffs as a wild card. The Mets finished 74-88, last in the division and 20 games behind first-place Atlanta. So the Mets were much worse over 162 games, yet they matched Philadelphia almost win for win in this rivalry. That tells you the Mets had real moments against the Phillies, and a few players were the reason why.
Juan Soto: The Best Mets Bat Against Philadelphia
If you only remember one name from this rivalry, make it Juan Soto. Across all 13 games he went 15-for-45, which works out to a .333 batting average. He hit three home runs, drove in eight runs, and scored six times.
The number that stands out most is his walk total. Soto drew 12 walks against the Phillies, which pushed his on-base percentage up to .474. In plain terms, he reached base almost every other time he came to the plate. His slugging percentage was .600, and his OPS, which combines on-base and power, was 1.074. Anything over 1.000 is excellent, and he did it over a stretch long enough to take seriously.
He was just as good in individual games. In the June 27 game, which I’ll cover below, he went 2-for-3 with a triple. Pitchers also treated him with respect, because they walked him more often than almost anyone else on the team got walked in this matchup. That is usually a sign a hitter is scaring the other side. Soto also led the Mets with 27 home runs for the year, so his numbers against Philadelphia fit what he did all season.
Tyrone Taylor and the Small Sample Surprises
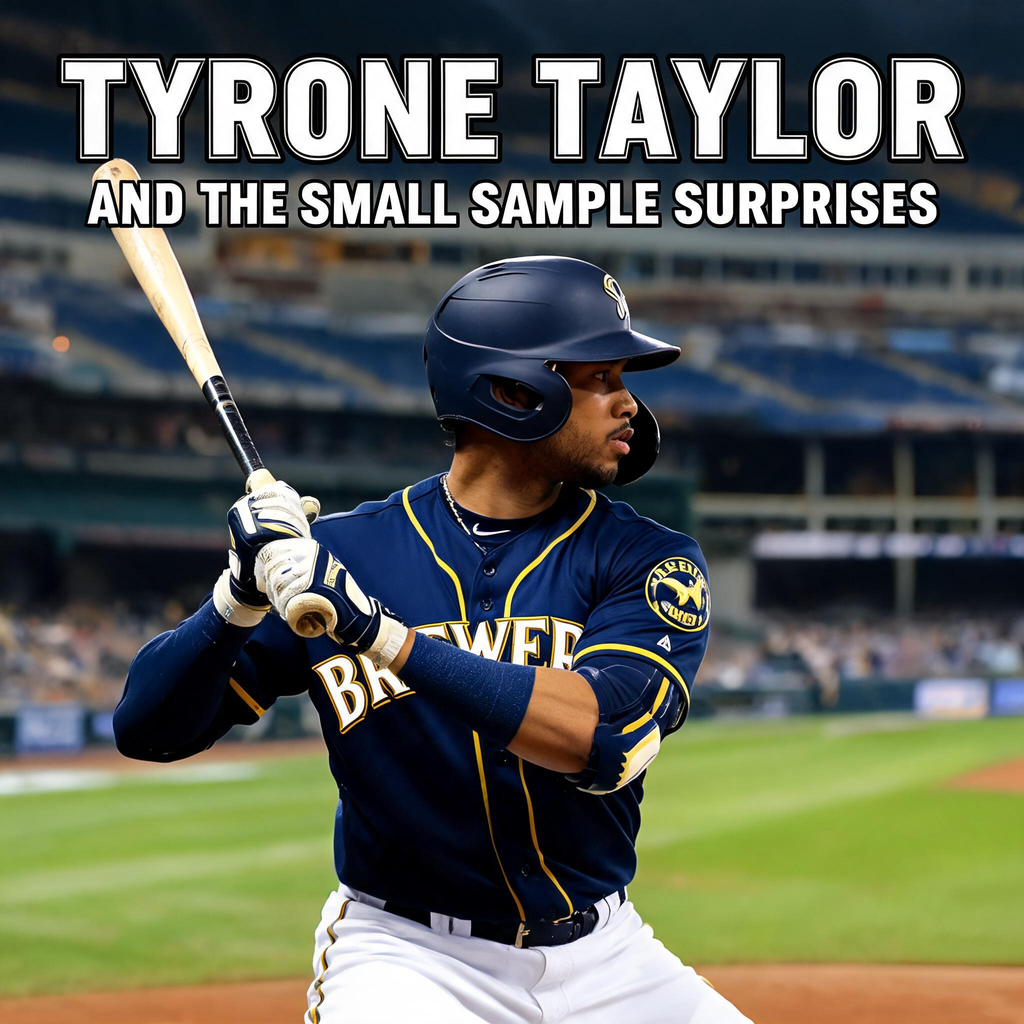
The wildest number on the StatMuse page belongs to Tyrone Taylor. He played just four games against the Phillies, but he went 5-for-8 at the plate. That is a .625 average, with a home run, two runs scored, and an OPS of 1.792.
It is fun to look at, but it needs a warning label. Eight at-bats is a tiny sample. One bad night could have dropped him to .400 and one great night could have pushed him past .700. Still, Taylor made his hits count, and a bench player who gets that kind of production at the right time can swing a close game.
Mark Vientos also had a nice time against Philadelphia. In 7 games he went 5-for-19 with a home run, a .263 average, and a .837 OPS. Luis Torrens was solid too, with 7 hits in 23 at-bats for a .304 average. Neither player lit up the scoreboard, but both gave the Mets steady at-bats when they needed them.
The Mets Hitters Who Struggled
Not everyone on the Mets enjoyed the Phillies. Bo Bichette played 13 games and hit just .192, going 10-for-52 with 13 strikeouts. He had one home run and three RBI. He also grounded into five double plays, which is a lot and likely hurt the Mets in a few rallies. His year overall was a different story, since he led the team with 78 RBI, so this looks like a rough matchup rather than a sign of a bad season.
Marcus Semien had it even worse. He went 4-for-32, a .125 average, with eight strikeouts and a .364 OPS. Eric Wagaman went 1-for-12, and Jorge Polanco went 0-for-4 in his one game. Jared Young hit only .105, though he reached base more than his average suggests, with four walks and two hit-by-pitches giving him a .320 on-base percentage.
Francisco Lindor sat somewhere in the middle. He played 9 games and hit .200, going 7-for-35, but he made his hits matter. He had two doubles, a triple, a home run, and six RBI. A hitter who goes 7-for-35 with extra-base hits and key RBI can still do a lot of damage. Brett Baty is another case, since his .219 average looks weak, but eight walks gave him a strong .375 on-base percentage.
A Closer Look at One Game: Mets 6, Phillies 2 on June 27
Season totals are useful, but sometimes the best way to understand player stats is to look at one real game. The June 27 matchup at Citi Field is a good one, because it shows how much can change in just two innings. You can see every number in the full Yahoo Sports box score.
The Phillies came in at 46-37 and the Mets at 35-48, so Philadelphia was the better team on paper. For the first five innings, that looked true. Bryce Harper hit a 402-foot home run in the third inning with a runner on, giving the Phillies a 2-0 lead. It was his 19th home run of the year. He finished 2-for-4 with two RBI, the only Phillies hitter with more than one hit.
The rest of the lineup struggled. Trea Turner and Kyle Schwarber both went hitless with two strikeouts each, though both drew a walk. As a team, the Phillies had only five hits and left five runners on base. Mets starter Christian Scott struck out six over 4.1 innings and allowed two runs.
Then the sixth inning arrived. The Mets scored four runs. Lindor tripled to right field and drove in Bichette and Soto to tie the game 2-2. A few batters later, A.J. Ewing singled to center and scored two more. In the seventh, Soto tripled to center and Bichette hit a sacrifice fly, adding two more runs.
On the pitching side, Mets reliever A.J. Minter picked up the win after 1.2 scoreless innings with one strikeout. Phillies pitcher A. Rangel took the loss, allowing four earned runs over four innings with four strikeouts and two walks. The game lasted only two hours and forty minutes, with light rain and 73-degree weather.
This game shows why the rivalry stays interesting. The Phillies had the better lineup and hit the home run, but the Mets won with timely hits, triples, and a bullpen that kept things quiet.
The Pitching Side of Mets vs Phillies
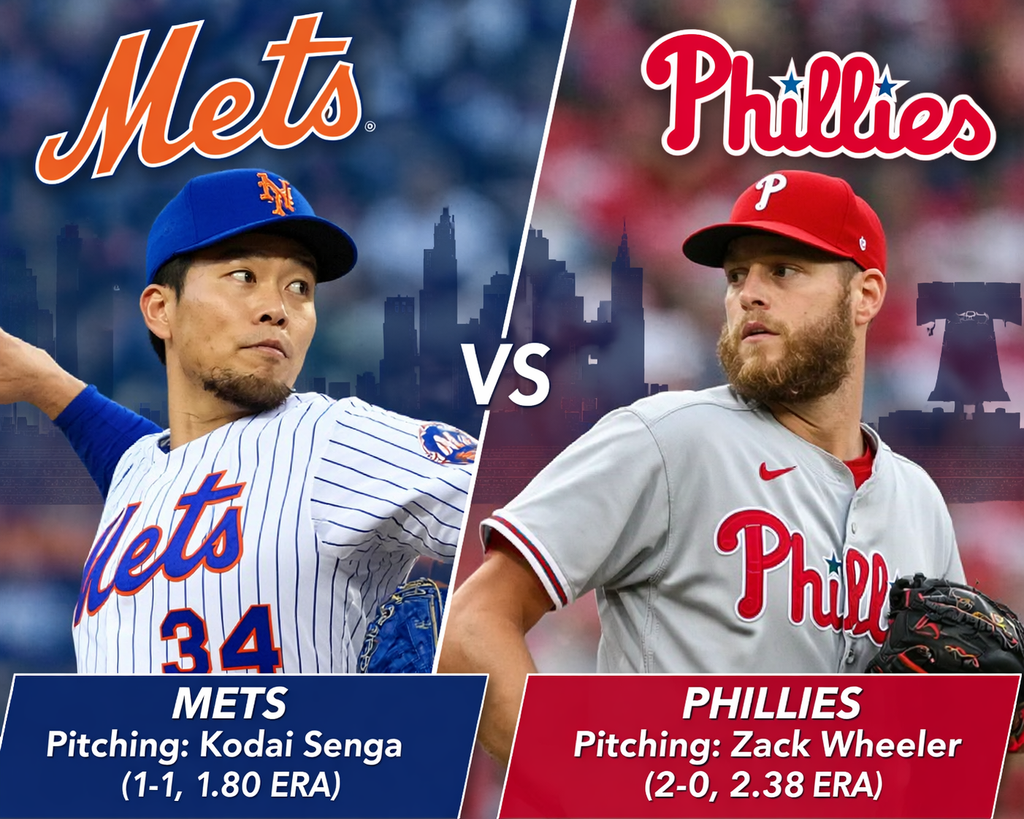
Hitting gets most of the attention, but pitching decided a lot of these games. For Philadelphia, the name to know is Cristopher Sánchez. Heading into the final meeting in September, he was 17-6 with a 2.93 ERA and 215 strikeouts, which made him the steadiest starter the Phillies had all year.
The Mets leaned on Nolan McLean, who led the team with 12 wins, 194 strikeouts, and a 3.16 ERA. Younger arms like Jonah Tong also got chances late in the year. Tong came into the September 20 game with a 2-1 record and a 3.43 ERA, and he faced Philadelphia in the final series. Rookies are always unpredictable, but his early numbers gave Mets fans something to look forward to.
Relievers mattered a lot too. Minter’s win in the June 27 game is one example. When a game between these two teams is close in the seventh inning, it is usually a bullpen battle from there.
How to Read These Stats Without Getting Fooled
Looking at player stats from one matchup is fun, but it is easy to read too much into them. The first rule is to check how many at-bats each player had. A hitter with 8 at-bats, like Tyrone Taylor, can look like a superstar or a flop based on just a few swings. A hitter with 45 or 52 at-bats, like Soto or Bichette, gives you a much more trustworthy picture.
The second rule is to look beyond batting average. On-base percentage tells you how often a hitter avoids making an out, and slugging percentage shows how much power he has. OPS combines the two. A player with a low average but a high on-base percentage, like Baty or Young, may still be helping his team more than the average suggests.
The third rule is to remember that stats do not tell you why something happened. A pitcher might have a bad line because of one tough inning, or a hitter might have a great line because he faced a weak reliever. Numbers are a starting point, and watching the games or reading a recap fills in the rest.
Where to Find Mets vs Phillies Player Stats
There are a few good places to look. StatMuse is great for quick answers, since you can type a question and get a clean table. Keep in mind that its batting table only covers hitters, so pitchers who never came to bat show up with zeros. ESPN’s MLB section and Yahoo Sports are better for single-game box scores and play-by-play. Baseball Reference is useful if you want deeper history, like how a player has done against a team over several years.
For the most reliable picture, use more than one source. A season table plus a box score gives you both the big trend and the story of a single night.
What to Watch in the Next Mets vs Phillies Season
The 2026 season is over for both teams, but the rivalry will be back in 2027. Soto’s numbers against Philadelphia suggest he will stay the Mets’ biggest threat, and the Phillies will need a plan for him. Bichette and Semien will want to bounce back, and if they do, the Mets lineup becomes much deeper.
For the Phillies, Harper, Turner, and Schwarber should stay the heart of the lineup, while Sánchez will lead the rotation. The Mets will hope McLean and Tong take another step forward. If they do, the gap between these two teams could shrink even more.
Read More: Nah Id Win
Final Thoughts
The Mets vs Phillies player stats from 2026 tell a clear story. Juan Soto was the best hitter in the matchup by a wide margin. Role players like Tyrone Taylor and Luis Torrens added surprise value. Bichette and Semien had a hard time, and Lindor made his hits count. On the Phillies side, Harper’s home run and Sánchez’s steady pitching were the main bright spots.
Whether you are a die-hard fan, a fantasy player, or someone who just wants to understand the rivalry, I hope these numbers made it easier to see who actually mattered.











Leave a Reply